Reviewing my last post on the end of the 2019, I am feeling bad that I have not updated any new blogs since then, even I can find the reason is so many things happened last year, especially the COVID hit. I have been working on some interesting projects last a few months, but majorly about data migration/transformation with google analytics, python, etc. Recently I noticed that some cool update on Power BI side, and there are some good solutions I am willing to share, so I decide to keep blogging it from now on. Hopefully I will have more excited project related to Power BI in the future to give more content, or maybe I will change to blog some tips and tricks instead of solutions.
Back to the topic, every Power BI user understands “Switch” is a quite powerful DAX formula to make dynamic calculations. E.g. Switch(True(),) or Switch(selectedvalue(),) and insert different measures in it. If it’s a Matrix visual, on top of that Switch measure we can add another Switch to format each values for currency or percentage. But there is always issue about how to use it in non-Matrix visual, like line chart. Because once you applied Format() function, the value will be converted to a string, and line visuals won’t allow us to add a string as values. Then I found a great solution in Tabular Editor, linked as External Tools of Power BI, the calculation groups which can alter the format of a switch type of measure into different format but stayed as value not string.
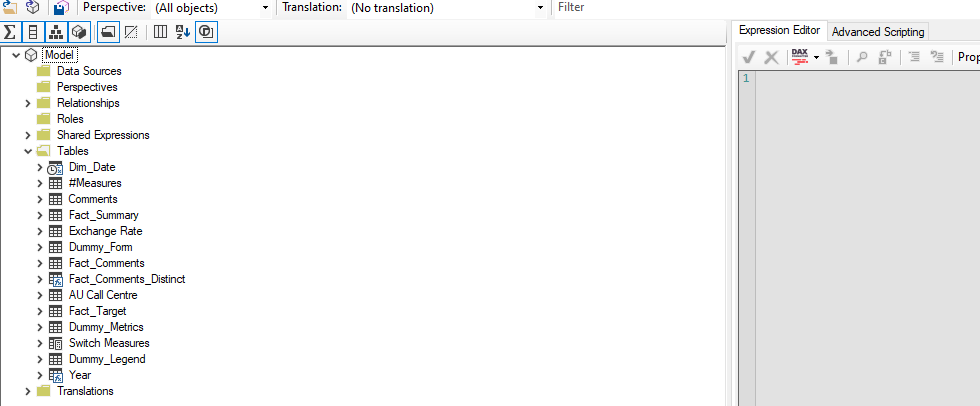
Let me introduce Tabular Editor first, you can downloaded from https://tabulareditor.com/ and when you restart your Power BI, you will see it under External Tools tab. And when you open it, Tabular Editor will automatically link to your Power BI dataset (Tabular Model)
Power BI External Tools Tab
Tabular Editor
Now what we need to do is creating a calculation group. Calculation Group is a very powerful function helping save tons of time to create redundancy measures, for example, you have measure like Bookings, Conversion Rate, and you also need apply time intelligence on top of them like YTD, MTD. Of course, you can use a switch to do the similar calculation, but you will need to define all those measures in a switch measure first. By using calculation group, you don’t need to do that, just simply created.
CACULATE(SELECTEDMEASURE(), DATESMTD ())
OR
CACULATE(SELECTEDMEASURE(), DATESYTD ())
The selectedmeasure() function will replace your measures like Bookings when you use it in a report page. And if you have a new measure in like Booking Revenue, the calculation group will do the same job for you. If you’d like to learn more about this, I highly recommended to read SQLBI posts https://www.sqlbi.com/calculation-groups/
My case is sort of different, by using calculation group I will need to use the “measure name” as one slicer to change different metrics, but I will also need to apply another layer of the switch to bring “current year” , “last year” and “target”. There might be a way to use one calculation group on top of the other one to make this work, but I didn’t get the luck. So I figured out a different solution.
There is one thing you will be aware of, once you add “measure name” as slicers in your report page, all the measures in that page will be treated as part of the calculation within the group, which means it will overwrite your existing measures, no matter what it is. So what I have done is like below steps:
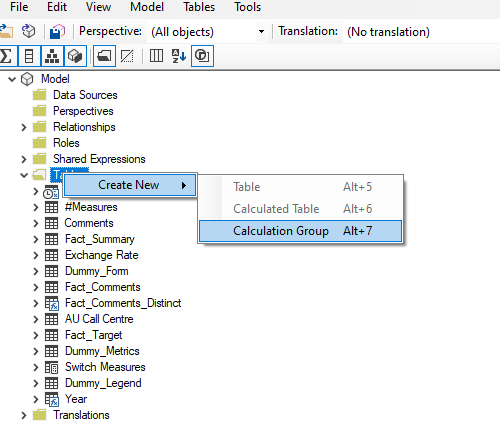
1. Create a Calculation Group
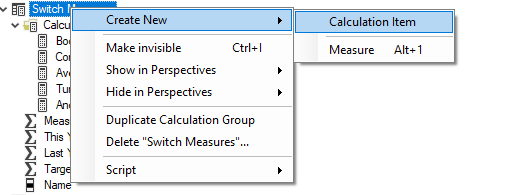
2. Create a Calculation Item
You will realize that there is “Name” column automated generated, you will use it as the slicer to switch between Calculation Items.
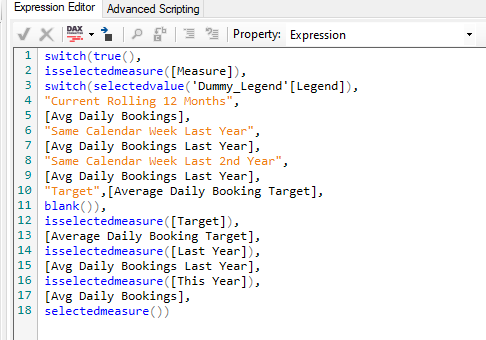
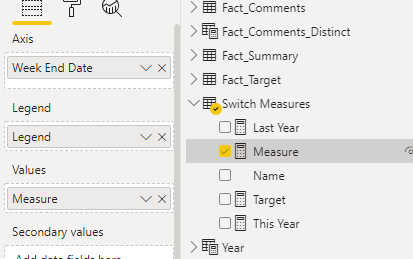
Because I know that I can use this to overwrite the existing measures in Power BI dataset, I made below dax to do my job. Within that the switch formula handles the legend/category in line chart, and using ISSELECTEDMEASURE() to do a conditional switch calculation based on the measure I used for different visuals.
3. Create Measures in Power BI
In Power BI, create related measure names used in the dax, and put a SELECTEDMEASURE() in it. Don’t worry, the calculation group will overwrite them. Use “Name” column as Slicer.
4. Change the format of Calculation Item
Update the properties “Format String Expression” of each Calculation Item, I think you can go further to make this in dax or make a reference table to make it dynamic as well. But I am just simply update it here. Till now, each Calculation Item has had their format and can be sliced in Power BI report like below chart.
Have Fun.
Eric Dong