Been busy in the past couple of months, my work is part of the reason, the other reason is I started a WOW guild in the oceanic classic server, one of the largest guild. Managing a guild is really like running a company, so I learnt a lot from this.
Anyway, there couple of things about my BI journey to share with you guys, and I will start with this real-time dashboard which is not really a new topic, but hopefully it will still help in some way.
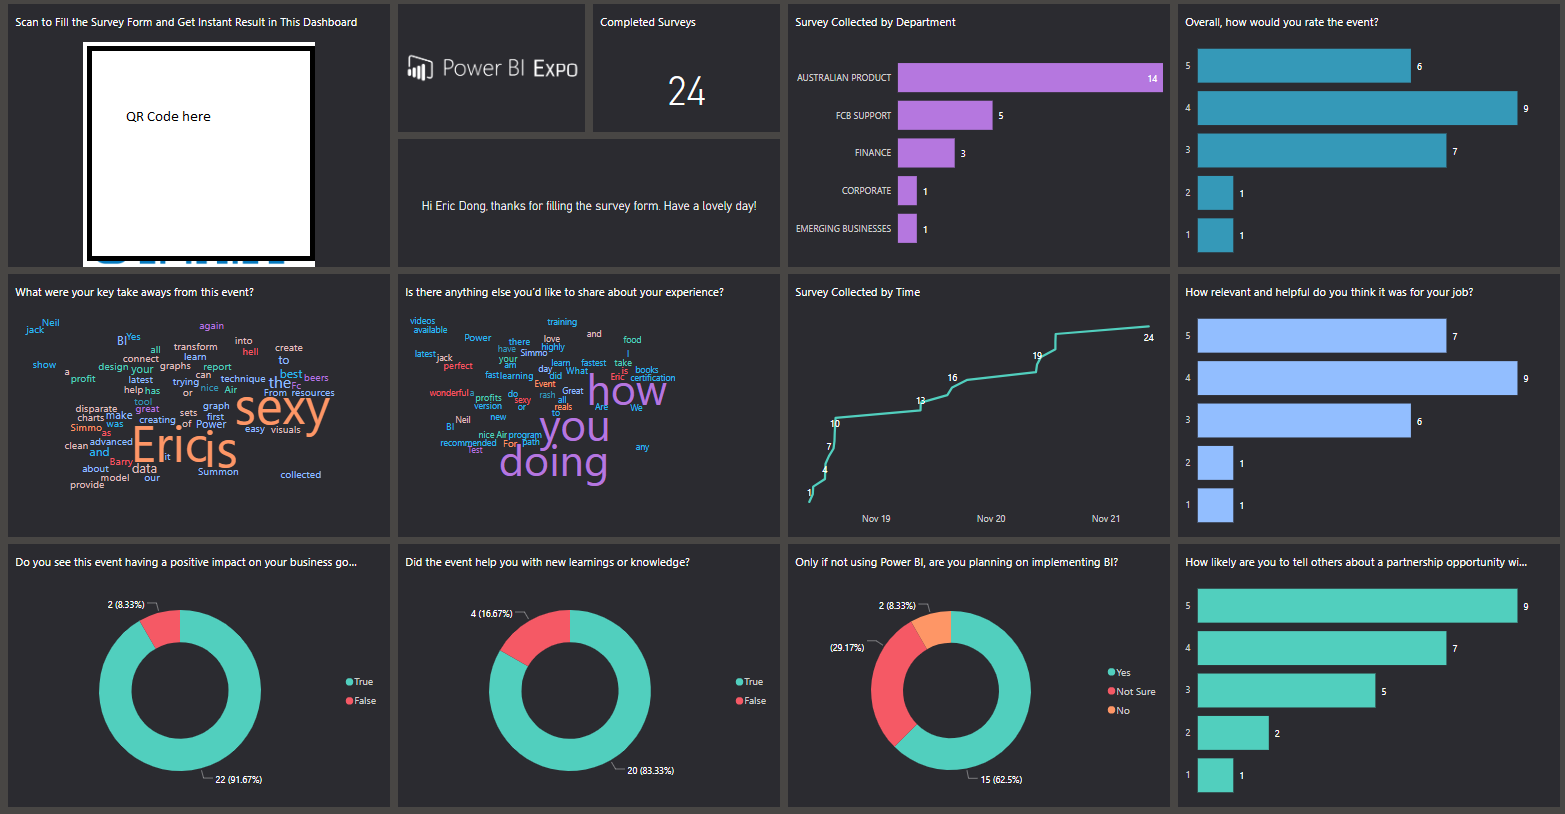
We are going to do a Power BI Expo within my organization, it’s kind of like a “show off” event, so a real-time interaction will be a very cool thing to present how powerful about Power BI and related apps on Power Platform. So the idea is presenting the survey results which are collected during the event in a real-time manner. The major tools I am using is Power BI and MS Flow.
Firstly, we need to know that Power BI Service Dashboard supports real-time visual refresh and streaming dataset is the key to push the real-time data, which means we don’t need to do any scheduled refresh.
1. Build stream dataset
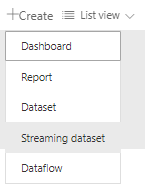
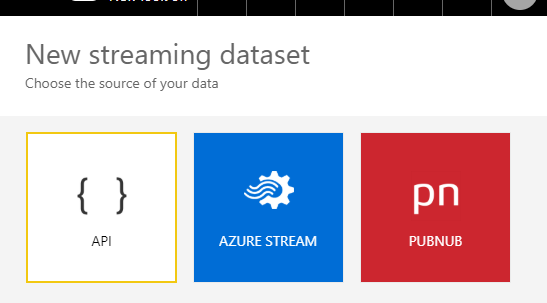
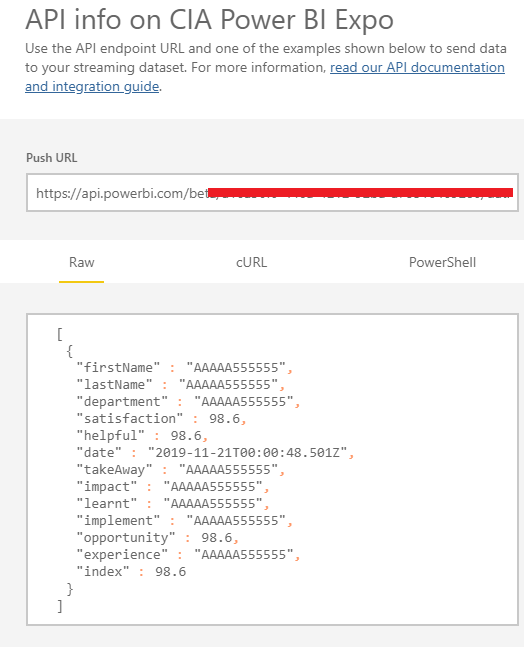
In any workspace, click “+Create”, in this case, I select API as my source of data, and then click “Next”
Now, I need to define the Dataset Name and the values from stream, there are only three types for values: Text, Number and Datetime. Toggle the Historic data analysis on.
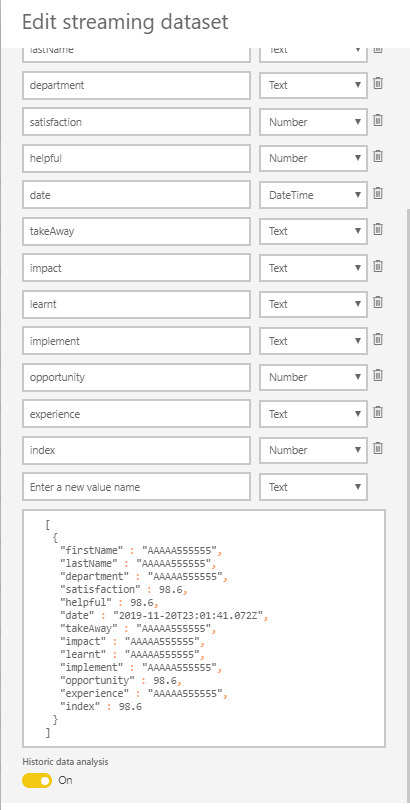
And then click “create”. Till now, the streaming dataset has been created, very simple.
2. Collect data and Push data to streaming dataset
This is the key step, there are different ways that you can leverage API to push your data into this dataset. I will introduce a simple way here including both collecting from the end-user and pushing data in one tool - MS Flow.
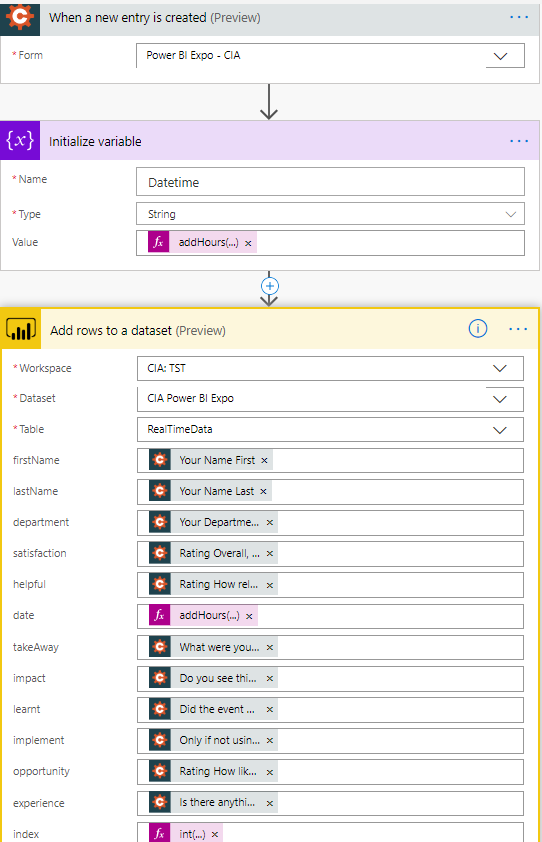
MS Flow has integrated “Push data to dataset” feature, which is more friendly and means you don’t need to have API knowledge. We just need an integrated trigger, I select Cognito Forms this time. MS Form is another good option.
Check below screenshot, loot at how simple it is :) It means, once there is a survey form submitted, the data will be pushed to streaming dataset.
3. Present the data
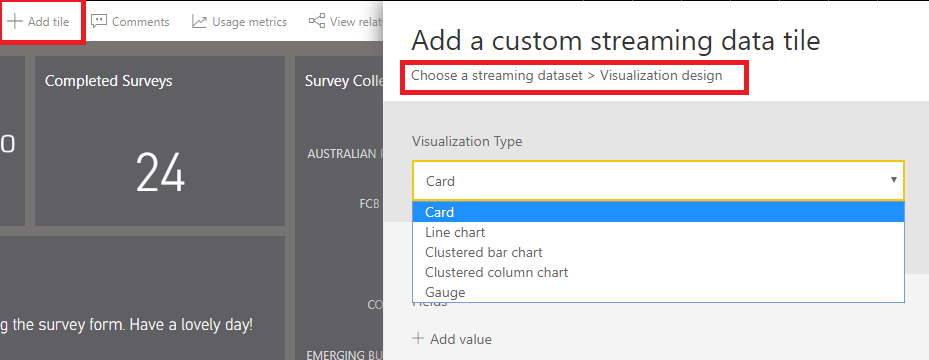
Now, we need to present the data and we are going to use Power BI Service Dashboard. The Dashboard supports streaming Tile, but the features are very limited (see below screenshot). So I created a report first from Power BI desktop.
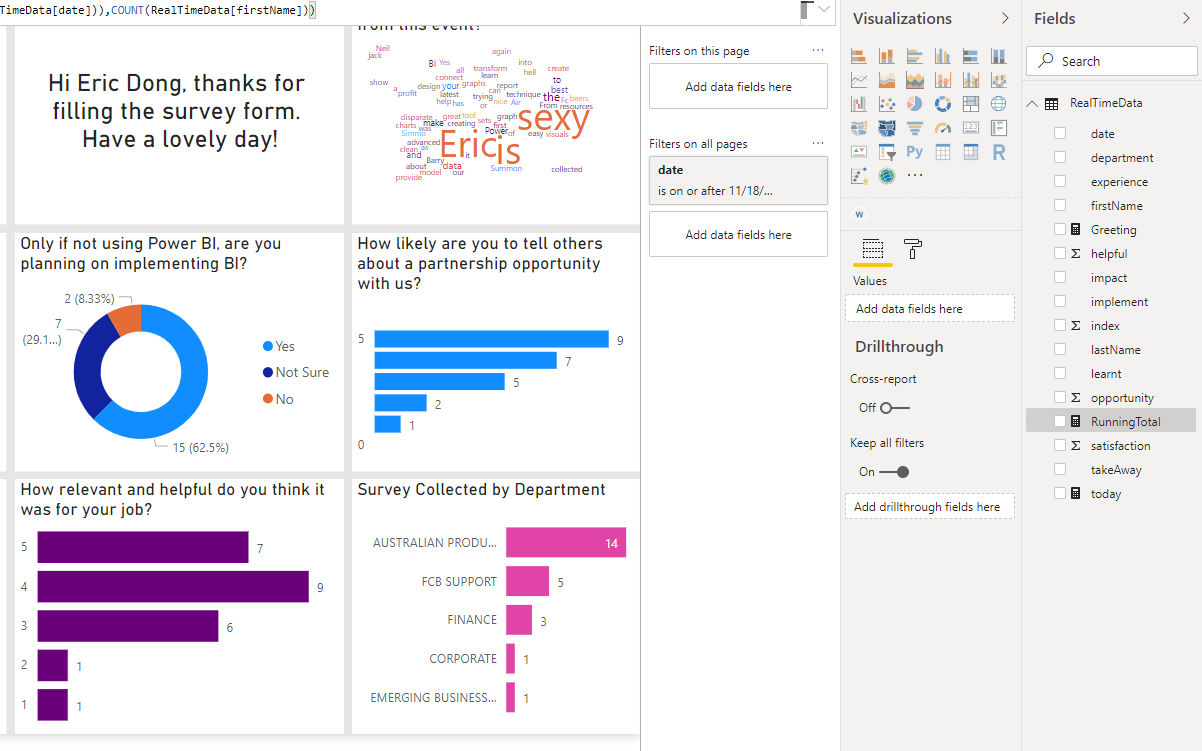
Open Power BI Desktop, connect to the streaming dataset we just created, and then you can use any visuals you like to build up a survey report.
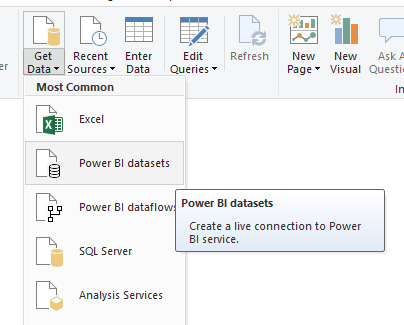
Just like using any other existing dataset to create a report, you can’t create any columns and link to new data to this model, but you can still create measures here.
After you finished this report, publish the report into the Power BI Service to pin each tile to create a Dashboard. Please be noted that pin live page from report won’t trigger the real-time refresh based on my testing. I have to pin each tile separately.
The last step is to create a QR code from the survey URL, there are a lot of free websites can do this job. Pin the QR Code picture into the dashboard. Now a full cycle has been completed. We present the dashboard on a big TV screen, the users scan the code, fill the form and submit, 2 seconds later, all the new data will be reflected in the dashboard. How COOL it is!
Thanks
Eric Dong