I consolidated some principles of designing Power BI report based on my recent development experience and former consulting experience.
And there is one principle leading all the others which is “Design a report providing in-depth insights with smooth user experience and little ongoing maintenance based on accurate data”.
So when I innovate a new principle, it must follow this major principle. For example, when I delivered Power BI training, I consolidated basic visualization principles to the users, like, “No Looks Fancy Report” - don’t download a lot of custom visuals to make the report looks fancy, because the chart might be too complex to be understood or it doesn’t deliver the message as clear as a simple bar chart. This principle is serving user experience.
Okay, further to my previous blog, I will introduce how to make date slicers for a certain days cycle in Power BI by using CALENDAR and MOD - this design is triggered by the major principle as well “smooth user experience and little ongoing maintenance”
Scenario:
In the existing report, the date slicer is the default one and user could select start and end date with sliding bar. Personally I don’t like this way of slicing (of course, if real need is a flexible enough slicer to check any day or any period, then it’s all good to use), because by week, by month or by quarter to slice is easier to use. I questioned the stakeholder, what’s the best way to slice your report from date perspective? The answer is by Roster Cycle - 28 days, and each region with a different start date of cycle, so when slice region A, the cycle should be based on region A’s start date. You see? I did find out the real need from stakeholder but set a trap for myself :) But I like this kind of challenge.
Solution:
Firstly I need to find out the start date of cycle of each region. There are four regions, South and East have the same start date, North and West’s start date is one day later. In the database, there is no start date indicator, but we know the max day is the last day of a cycle which could be the current or next and could be South and East or North and West. So I am using below SQL scripts to get current Cycle’s start date of each region.
DECLARE @Maxdate DATE  = (select CONVERT(DATE,MAX(day_date)) FROM xxxxxx WHERE day_date > GETDATE())
DECLARE @AdjustMaxdate DATE
IF DATEPART(WEEKDAY,@Maxdate) = 7
SET @AdjustMaxdate = DATEADD(DAY,1,@Maxdate)
ELSE
SET @AdjustMaxdate =  @Maxdate
DECLARE @Today DATE = CAST(GETDATE() AS DATE)
DECLARE @Datediff INT = DATEDIFF(DAY,@Today,@AdjustMaxdate)
DECLARE @Number INT = @Datediff /28

DECLARE @NWStartdate DATE = DATEADD(DAY, - 28 * (@Number+1) +1,@AdjustMaxdate)
DECLARE @EStartdate DATE = DATEADD(DAY,-1,@NWStartdate)

SELECT @NWStartdate AS NWstartdate,@EStartdate AS EStartdate,@Today as RunDate
Once I got these dates, I moved to Power BI to setup cycle table now.
The request is to check previous 6 cycles, current and next cycle. So I am using CALENDAR to create date table first.
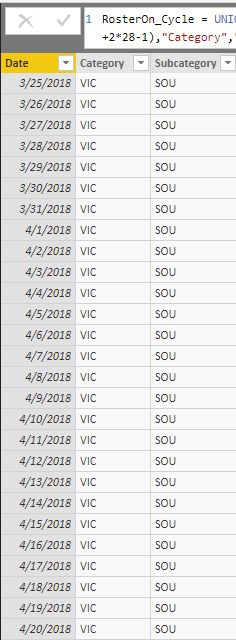
RosterOn_Cycle = UNION(
ADDCOLUMNS(CALENDAR(max(RosterOn_CurrentRosterCycle[EStartdate])-6*28,MAX(RosterOn_CurrentRosterCycle[EStartdate])+2*28-1),"Category","VIC","Subcategory","SOU"),
ADDCOLUMNS(CALENDAR(max(RosterOn_CurrentRosterCycle[EStartdate])-6*28,MAX(RosterOn_CurrentRosterCycle[EStartdate])+2*28-1),"Category","VIC","Subcategory","EAS"),
ADDCOLUMNS(CALENDAR(max(RosterOn_CurrentRosterCycle[NWstartdate])-6*28,MAX(RosterOn_CurrentRosterCycle[NWstartdate])+2*28-1),"Category","VIC","Subcategory","NOR"),
ADDCOLUMNS(CALENDAR(max(RosterOn_CurrentRosterCycle[NWstartdate])-6*28,MAX(RosterOn_CurrentRosterCycle[NWstartdate])+2*28-1),"Category","VIC","Subcategory","WES"))
Then, we will see a date table like this
How do we cut these dates table based on 28 days? My method is using Index and Mod, if you have better way, please let me know.
Create an index column per Region
Index = RANKX(FILTER(RosterOn_Cycle,
EARLIER(RosterOn_Cycle[Category])= RosterOn_Cycle[Category] &&
EARLIER(RosterOn_Cycle[Subcategory])=RosterOn_Cycle[Subcategory]),
RosterOn_Cycle[Date],,ASC)
Then use Mod to get a column with intiger based on Index column, the logic is very simple, e.g. Mod(5,28) = 0, FLOOR(Mod(35,28)) = 1,FLOOR(Mod(87,28))=2…
CycleNumbers = if(MOD(RosterOn_Cycle[Index],28)=0,
FLOOR(RosterOn_Cycle[Index]/28,1)-1,
FLOOR(RosterOn_Cycle[Index]/28,1))
Generate a column for slicer use
RosterCycle = SWITCH(TRUE(),
RosterOn_Cycle[CycleNumbers] = 7, "Next Cycle",
RosterOn_Cycle[CycleNumbers] = 6,"Current Cycle",
"Previous Cycle "&(RosterOn_Cycle[CycleNumbers]-6))
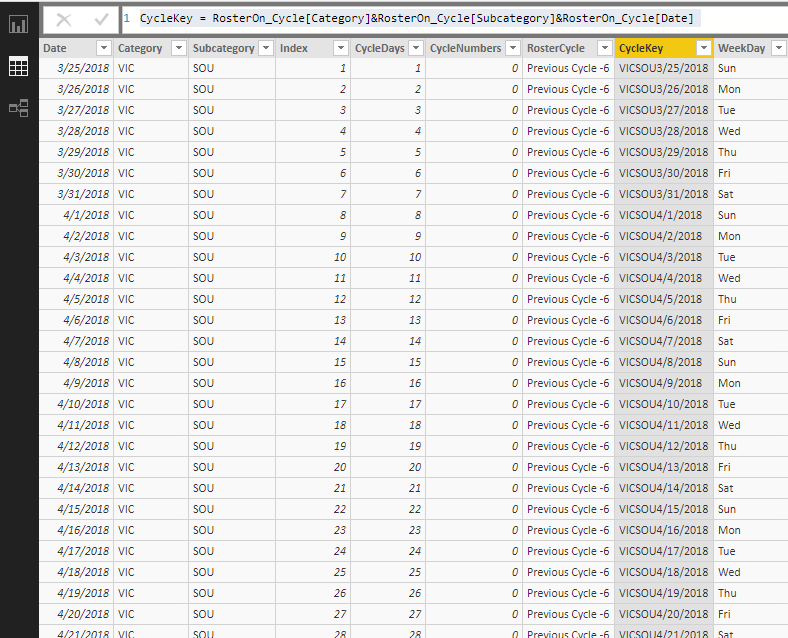
Generate Key comlumn to link back to the Fact Table with region as date
CycleKey = RosterOn_Cycle[Category]&RosterOn_Cycle[Subcategory]&RosterOn_Cycle[Date]
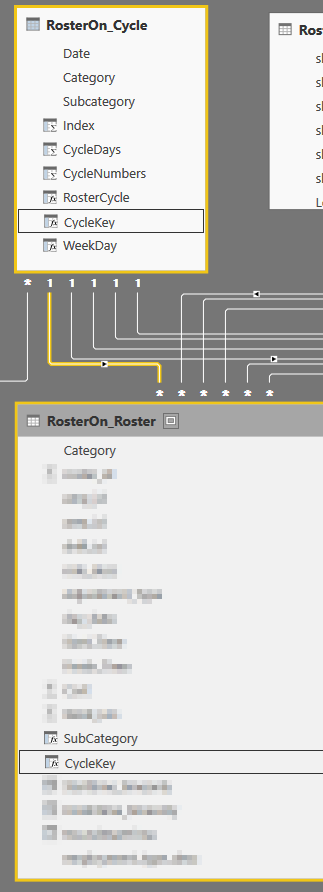
Now we can see the table and model like below
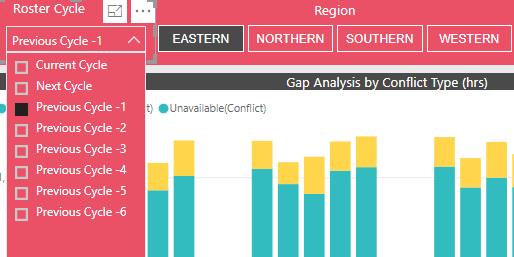
Finally, add roster cycle and region slicers, all done!
Recently, I was using Microsoft Flow to integrate Sentiment Analysis API and MS forms to feed data to Power BI and calling Power BI API to refresh dataset, which are very exciting solutions, I might blog them in the future.
Have Fun~
Thanks Eric Dong