
For a non-target promotion campaign, like “Black Friday”, the campaign period is kind of flexible. A Power BI report should be able to provide a flexible experience to users that they can select any period they like to check the campaign performance. So the dynamic calculations are essential for this report based on the start date and end date which the users selected.
And we know we can use customer retention metrics to measure the success of a campaign. Also, if you are familiar with Google Analytics, you must know below cohort chart which indicate the users’ retention.
Example:
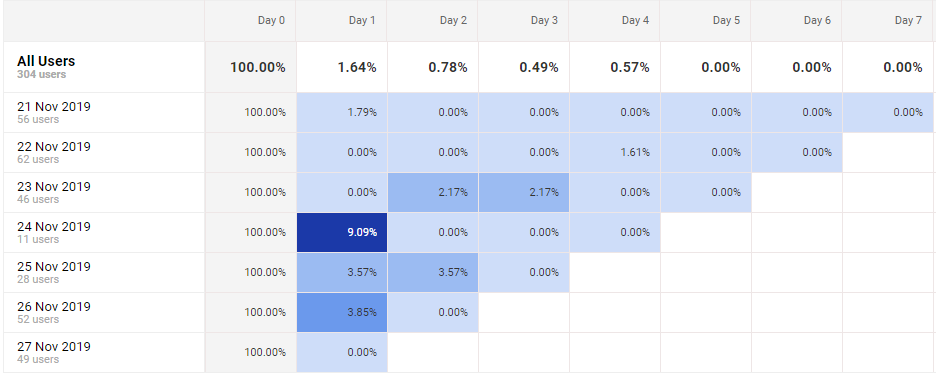
What I am going to do is replicating this cohort analysis chart into Power BI and as I said at the beginning we need to make it a dynamic to achieve best user experience, which means a static calculated table won’t do the job as other tutorials introduced.
1. Build date slicer
This date slicer is not like normal date table we use to link to the fact table to do the filter. We use this data table to generate two date points by using min() and max(), and if we apply whatif paramter , E.g. EndDate = MAX(Dim_DateSlicer[SliceDate]); Postdate = [EndDate] + 'Days Prior/Post To Campaign'[Days Prior/Post To Campaign Value] ,we can easily generate dynamic measures like previous campaign and post campaign period performance based on this. E.g. Post Campaign = CALCULATE([measure],FILTER(Fact_Booking,Fact_Booking[BookingDate]>[EndDate]&&Fact_Booking[BookingDate]<=[Postdate]))
We can use data slicer as a table like to fact table as we usually do, and then use ALL() to ignore the data slicer to calculate another period. But the inefficient side is if we have other slicers like product type, etc., we have to use ALLEXCEPT() to add all the other slicers in each measure. So, I don’t recommend it.
We create a single date slicer table, keep the dim_date table to do other time intelligence calculation.
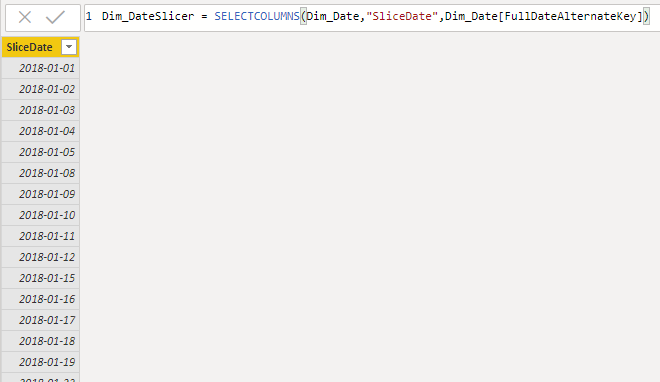
2. Prepare for the Cohort analysis
Now, let’s move to the cohort chart, the material we have is a fact table like below
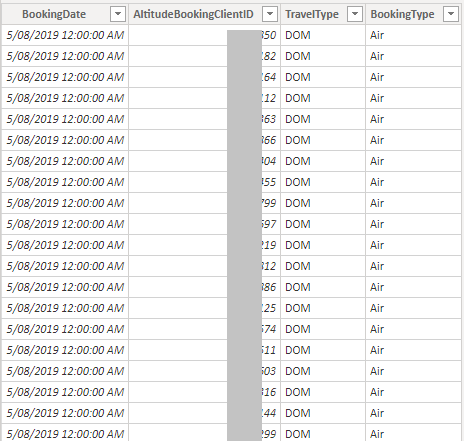
As we said as the beginning, we would like users to slide the date slicer bar to see any period as they want. We can’t just generate a calculated table to prepare the data for customer retentions as the calculation happened before the slice. We will need one measure to solve everything.
Let’s see the logic:
- we need to get the customers participated in the campaign
- days passed by, some customers in the above group (1) are retained in a certain period
- difficult part: customers in above group(2) are retained in its future period
So, we need two dimensions in this chart for group 1 and group 2 customers. Because the campaign date range is not fixed and the dimensions have to be fixed, we need a certain way to make it relatively fixed and be involved in the calculations. My idea is using the number of days after the campaign. We need two dimensions like below

add a ranking index for sorting
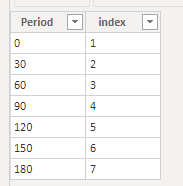
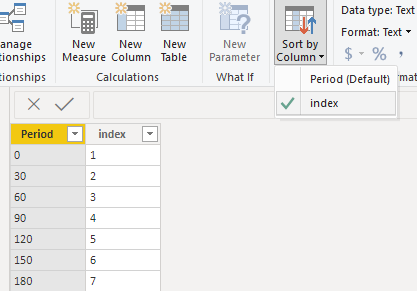
replicate table to create the second dimension

3. Build the Cohort table
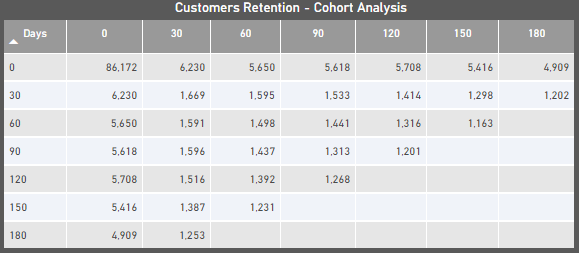
A table can help us to verify the logic and the accuracy of numbers. The method is
- using sliced date and the context of SELECTEDVALUE(days in two dimensions) to generate start date and end date for each cell.
- declare calculated table as variable to be resued (join itself), see
allcusotmersandcustomersin below DAX. - classic SWITCH method to apply each calculation based above two materials, the calculation is the certain group of customers’ booking in a certain period
Customers in Campaign Cohort =

var period1 = int(SELECTEDVALUE(Dim_SW_Period[Period]))

var period2 = int(SELECTEDVALUE(Dim_SW_Period2[Period]))

var date1 = [EndDate] + period1 - 30
var date2 = [EndDate] + period1
var date3 = [EndDate] + period2 - 30
var date4 = [EndDate] + period2
var date5 = [EndDate] + period1 + period2 - 30
var date6 = [EndDate] + period1 + period2

var allcusotmers = CALCULATETABLE(VALUES(Fact_Customers[ClientID]), FILTER(Fact_Customers,Fact_Customers[BookingDate]>=[StartDate] && Fact_Customers[BookingDate]<=[EndDate]))

var customers =
CALCULATETABLE(VALUES(Fact_Customers[ClientID]),
FILTER(ALL(Fact_Customers),CONTAINS(allcusotmers,Fact_Customers[ClientID],Fact_Customers[ClientID])),
FILTER(ALL(Fact_Customers), Fact_Customers[BookingDate]>date1 &&Fact_Customers[BookingDate]<=date2))

return

SWITCH(TRUE(),
period1=0 && period2=0,
CALCULATE(DISTINCTCOUNT(Fact_Customers[ClientID]),
FILTER(Fact_Customers,Fact_Customers[BookingDate]>=[StartDate]&&Fact_Customers[BookingDate]<=[EndDate])),
period2=0,
CALCULATE(DISTINCTCOUNT(Fact_Customers[ClientID]),
FILTER(ALL(Fact_Customers),CONTAINS(allcusotmers,Fact_Customers[ClientID],Fact_Customers[ClientID])),
FILTER(ALL(Fact_Customers), Fact_Customers[BookingDate]>date1 &&Fact_Customers[BookingDate]<=date2))
,
period1=0,
CALCULATE(DISTINCTCOUNT(Fact_Customers[ClientID]),
FILTER(ALL(Fact_Customers),CONTAINS(allcusotmers,Fact_Customers[ClientID],Fact_Customers[ClientID])),
FILTER(ALL(Fact_Customers), Fact_Customers[BookingDate]>date3 &&Fact_Customers[BookingDate]<=date4))
,

CALCULATE(DISTINCTCOUNT(Fact_Customers[ClientID]),
FILTER(ALL(Fact_Customers),CONTAINS(customers,Fact_Customers[ClientID],Fact_Customers[ClientID])),
FILTER(ALL(Fact_Customers), Fact_Customers[BookingDate]>date5 &&Fact_Customers[BookingDate]<=date6))
)
this measure has been tuned a couple of times as the first version took more than 10 seconds to run, and now I am happy with the performance.

4. Build the Cohort chart
Hide the first row and present figure and percentage in one cell for a better understanding.
Customers in Campaign Cohort #% =

var period1 = int(SELECTEDVALUE(Dim_SW_Period[Period]))

var period2 = int(SELECTEDVALUE(Dim_SW_Period2[Period]))

var date1 = [EndDate] + period1 - 30
var date2 = [EndDate] + period1
var date3 = [EndDate] + period2 - 30
var date4 = [EndDate] + period2
var date5 = [EndDate] + period1 + period2 - 30
var date6 = [EndDate] + period1 + period2

var allcusotmers = CALCULATETABLE(VALUES(Fact_Customers[ClientID]), FILTER(Fact_Customers,Fact_Customers[BookingDate]>=[StartDate] && Fact_Customers[BookingDate]<=[EndDate]))

var customers =
CALCULATETABLE(VALUES(Fact_Customers[ClientID]),
FILTER(ALL(Fact_Customers),CONTAINS(allcusotmers,Fact_Customers[ClientID],Fact_Customers[ClientID])),
FILTER(ALL(Fact_Customers), Fact_Customers[BookingDate]>date1 &&Fact_Customers[BookingDate]<=date2))

var number =CALCULATE(DISTINCTCOUNT(Fact_Customers[ClientID]),
FILTER(ALL(Fact_Customers),CONTAINS(allcusotmers,Fact_Customers[ClientID],Fact_Customers[ClientID])),
FILTER(ALL(Fact_Customers), Fact_Customers[BookingDate]>date1 &&Fact_Customers[BookingDate]<=date2))

return

SWITCH(TRUE(),
period1=0 , BLANK()  ,
period2 =0, format(number,"#,0")
,
format(CALCULATE(DISTINCTCOUNT(Fact_Customers[ClientID]),
FILTER(ALL(Fact_Customers),CONTAINS(customers,Fact_Customers[ClientID],Fact_Customers[ClientID])),
FILTER(ALL(Fact_Customers), Fact_Customers[BookingDate]>date5 &&Fact_Customers[BookingDate]<=date6)),"#,0") & "  " & FORMAT(DIVIDE(CALCULATE(DISTINCTCOUNT(Fact_Customers[ClientID]),
FILTER(ALL(Fact_Customers),CONTAINS(customers,Fact_Customers[ClientID],Fact_Customers[ClientID])),
FILTER(ALL(Fact_Customers), Fact_Customers[BookingDate]>date5 &&Fact_Customers[BookingDate]<=date6)),number),"#,0%")
)
Create a measure for conditional formatting, it’s almost the same, just ignore both first row and column.
Customers in Campaign Cohort % =

var period1 = int(SELECTEDVALUE(Dim_SW_Period[Period]))

var period2 = int(SELECTEDVALUE(Dim_SW_Period2[Period]))

var date1 = [EndDate] + period1 - 30
var date2 = [EndDate] + period1
var date3 = [EndDate] + period2 - 30
var date4 = [EndDate] + period2
var date5 = [EndDate] + period1 + period2 - 30
var date6 = [EndDate] + period1 + period2

var allcusotmers = CALCULATETABLE(VALUES(Fact_Customers[ClientID]), FILTER(Fact_Customers,Fact_Customers[BookingDate]>=[StartDate] && Fact_Customers[BookingDate]<=[EndDate]))

var customers =
CALCULATETABLE(VALUES(Fact_Customers[ClientID]),
FILTER(ALL(Fact_Customers),CONTAINS(allcusotmers,Fact_Customers[ClientID],Fact_Customers[ClientID])),
FILTER(ALL(Fact_Customers), Fact_Customers[BookingDate]>date1 &&Fact_Customers[BookingDate]<=date2))

var number =CALCULATE(DISTINCTCOUNT(Fact_Customers[ClientID]),
FILTER(ALL(Fact_Customers),CONTAINS(allcusotmers,Fact_Customers[ClientID],Fact_Customers[ClientID])),
FILTER(ALL(Fact_Customers), Fact_Customers[BookingDate]>date1 &&Fact_Customers[BookingDate]<=date2))

return

SWITCH(TRUE(),
period1=0 || period2=0, BLANK()
,
DIVIDE(CALCULATE(DISTINCTCOUNT(Fact_Customers[ClientID]),
FILTER(ALL(Fact_Customers),CONTAINS(customers,Fact_Customers[ClientID],Fact_Customers[ClientID])),
FILTER(ALL(Fact_Customers), Fact_Customers[BookingDate]>date5 &&Fact_Customers[BookingDate]<=date6)),number)
)
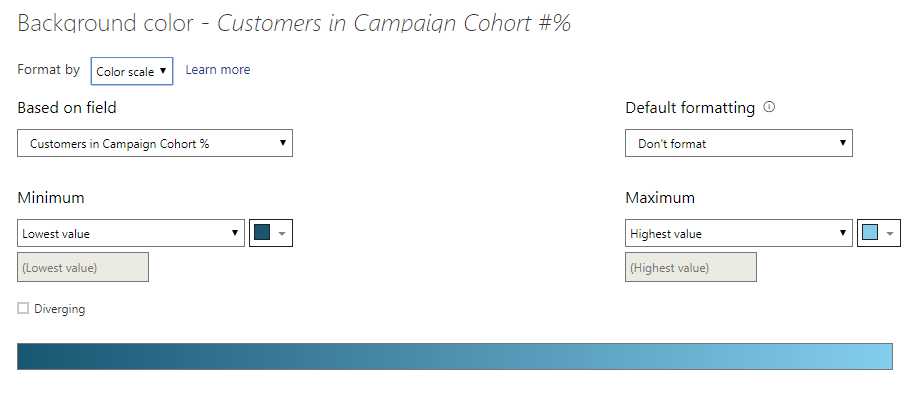
Okay, now you can play with it by sliding the bar, looks pretty cool, right? :)

Thanks
Eric Dong